
Land Intelligence — zoning & CRE analysis in the browser
A MapLibre GL JS application framework with full ArcGIS Enterprise, Server and Portal integration. Discover data from public GIS catalogs, load it beside cloud-native formats and commercial property records, then analyze it — with the geoprocessing running client-side in DuckDB WASM, so nothing leaves the device.
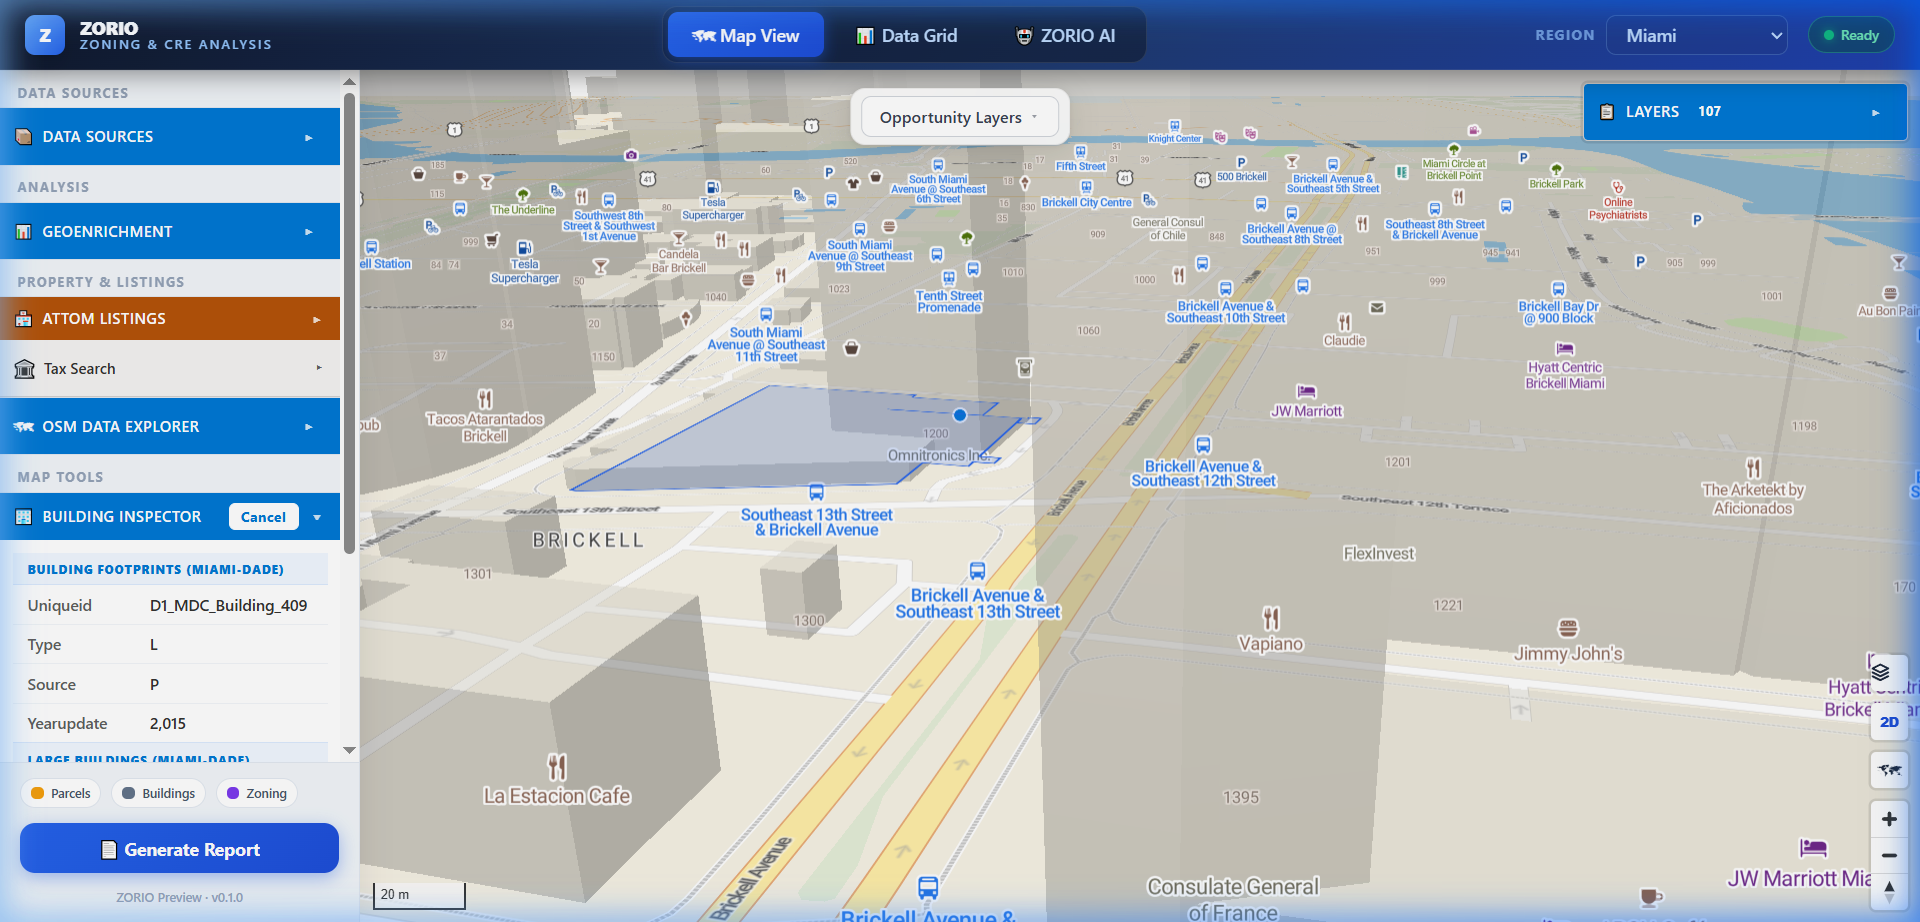
Pick mode queries multiple ArcGIS FeatureServer layers at once and highlights the matched footprint.
Discover. Connect. Analyze. Report.
Users reach data three ways — browse a catalog, connect directly to a service, or open the single aggregated Data Source Manager. What happens after that is where the work gets done.
Catalog discovery
Browse the USA government GIS directory by jurisdiction, state and service type; search ESRI Living Atlas and ArcGIS Hub open data; query STAC catalogs; load portal WebMaps, WebScenes and CatalogLayers.
Direct service connections
ArcGIS Feature, Dynamic Map, Tiled Map, Image and Vector Tile Services; OSM-backed FeatureServers; and GeoJSON rendered automatically from its SimpleStyleSpec properties.
In-browser geoprocessing
Buffer, spatial join, dissolve, clip, summarize-within, convex hull, area and length — all through DuckDB WASM, with a wizard UI for end users and a programmatic geoprocessor for developers.
Parcel & property intelligence
Regrid nationwide parcel boundaries with click-to-identify; ATTOM detail, AVM and sale history for commercial, industrial and agricultural property; county tax and appraisal record search.
GeoEnrichment & CRE analysis
15,000+ demographic, economic, housing and business variables by click, address, geography or drawn polygon — plus site scoring, demand indices, risk flags and branded PDF/XLSX reports.
Imagery, terrain & 3D
USDA NAIP and USGS imagery, DEM hillshade and terrain, COG raster analytics via Pyodide, COPC LiDAR, oriented and street-level imagery, and 3D Tiles styled by zoning class or floor count.
Ask the map a question
AI Analyst is a tool-calling agent wired directly to the analysis layers and the indexed zoning ordinance. Ask for underbuilt parcels near transit, open code violations, lien hotspots, stalled permits, rezoning and assemblage candidates or composite opportunity scores — it queries the real data, answers in plain language, and renders the matching features on the map.
- Queries live DuckDB views over the per-city analysis layers — no hallucinated geometry.
- Searches the full-text zoning ordinance corpus and cites the source URL for every rule.
- Natural language to read-only SQL, with the result set returned as rows and map features.
- Deterministic keyword fallback, so the chat still answers with real data if the model is unavailable.
Ask what the code says
The same chat answers ordinance questions. Ask “What does the code say about parking in Miami?” and the agent searches the indexed zoning code and returns the matching passages — each labelled with its article or appendix, the jurisdiction and a link back to the source.
- Answers show excerpts of the ordinance text, not a paraphrase of it.
- Every passage carries its section title and source link, so the rule can be checked where it is published.
- Lives in the same panel as the map queries — no separate code-search tool to open.
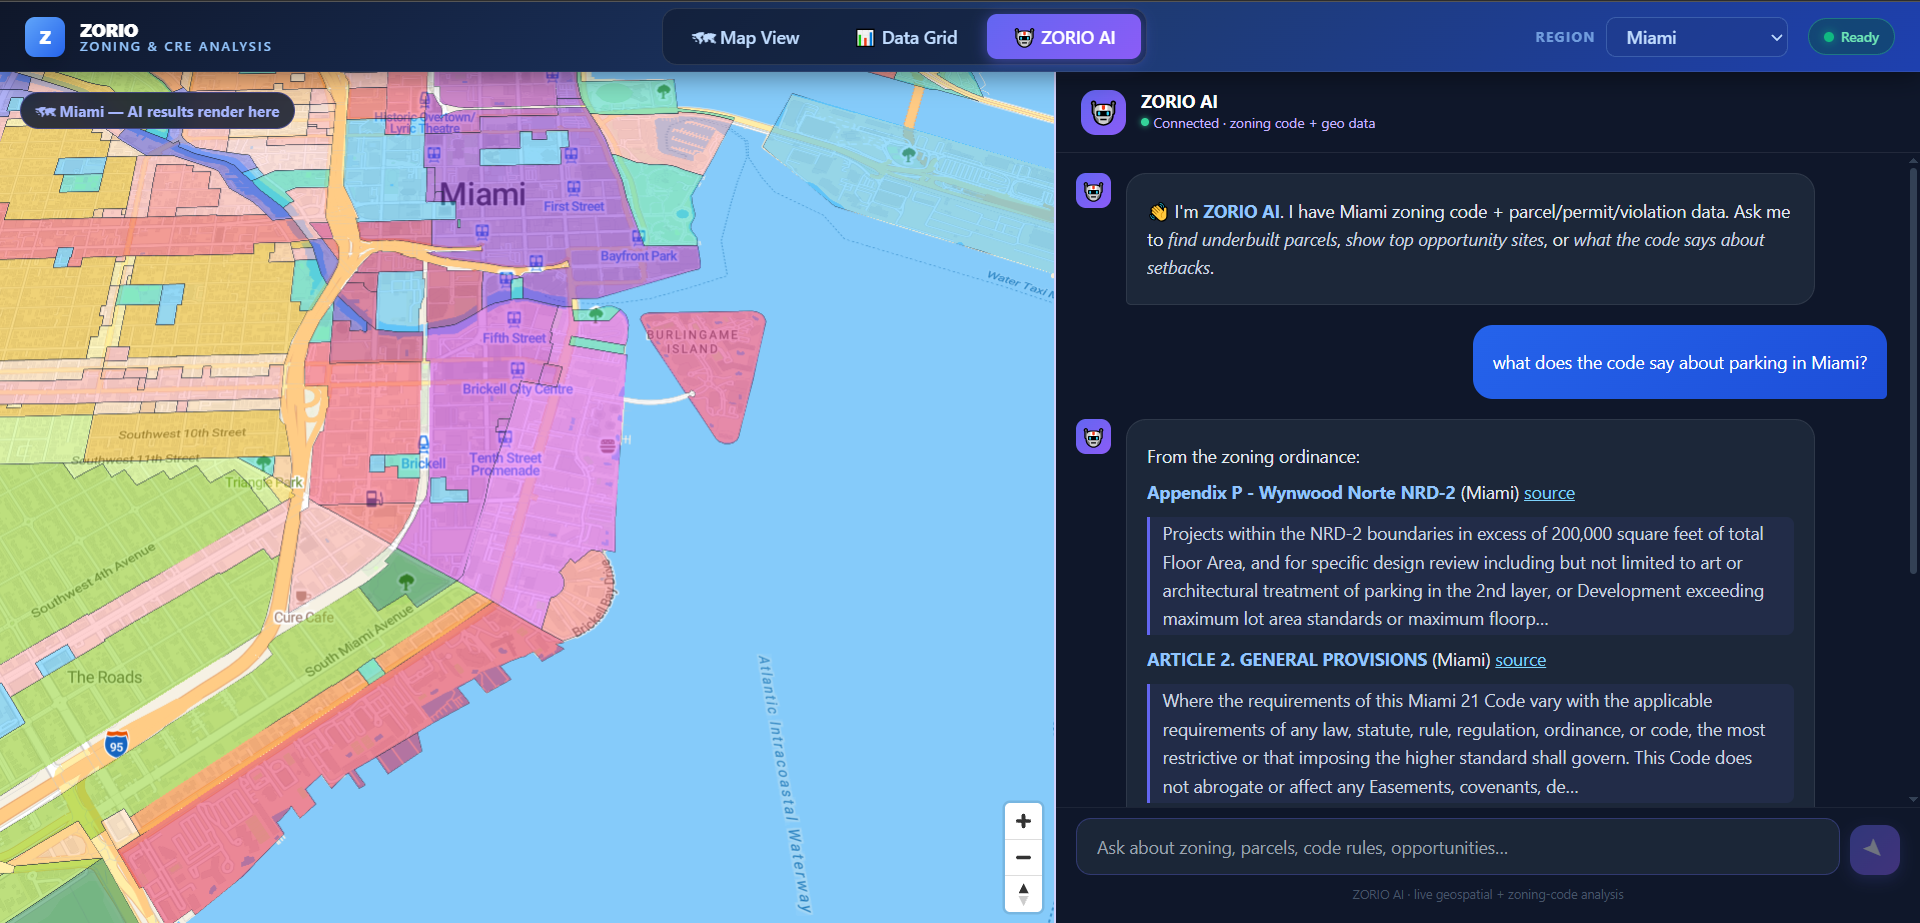
Three views on the same data
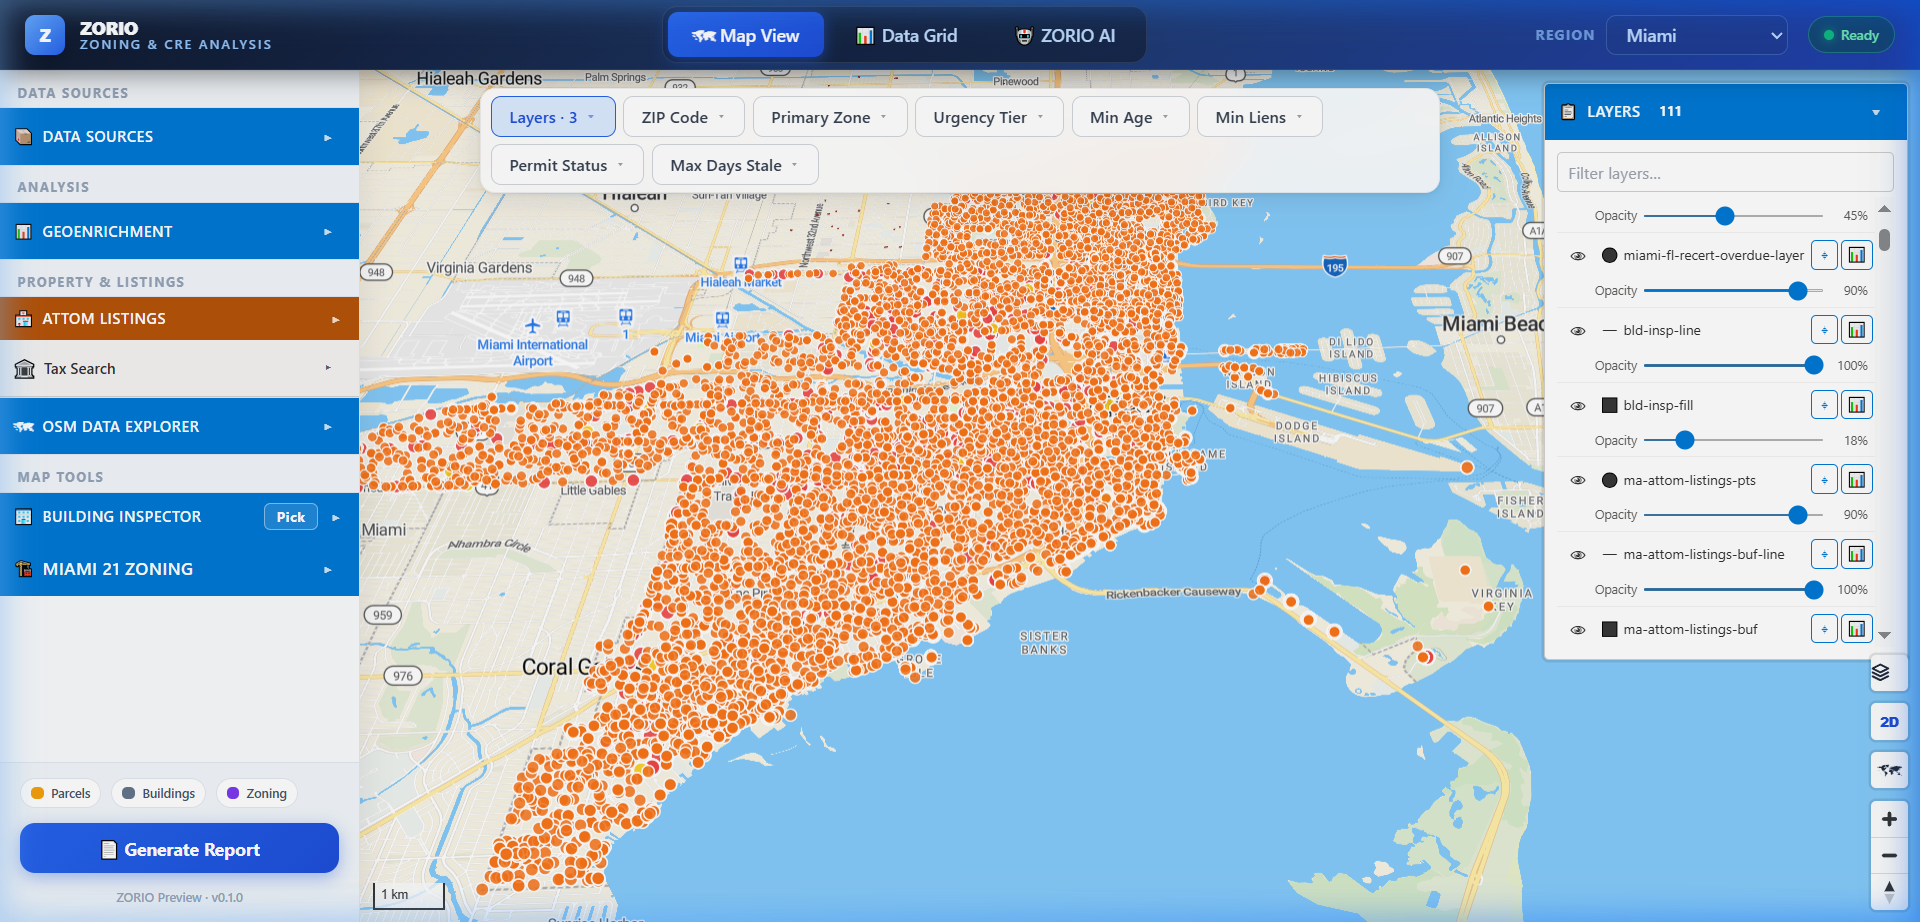
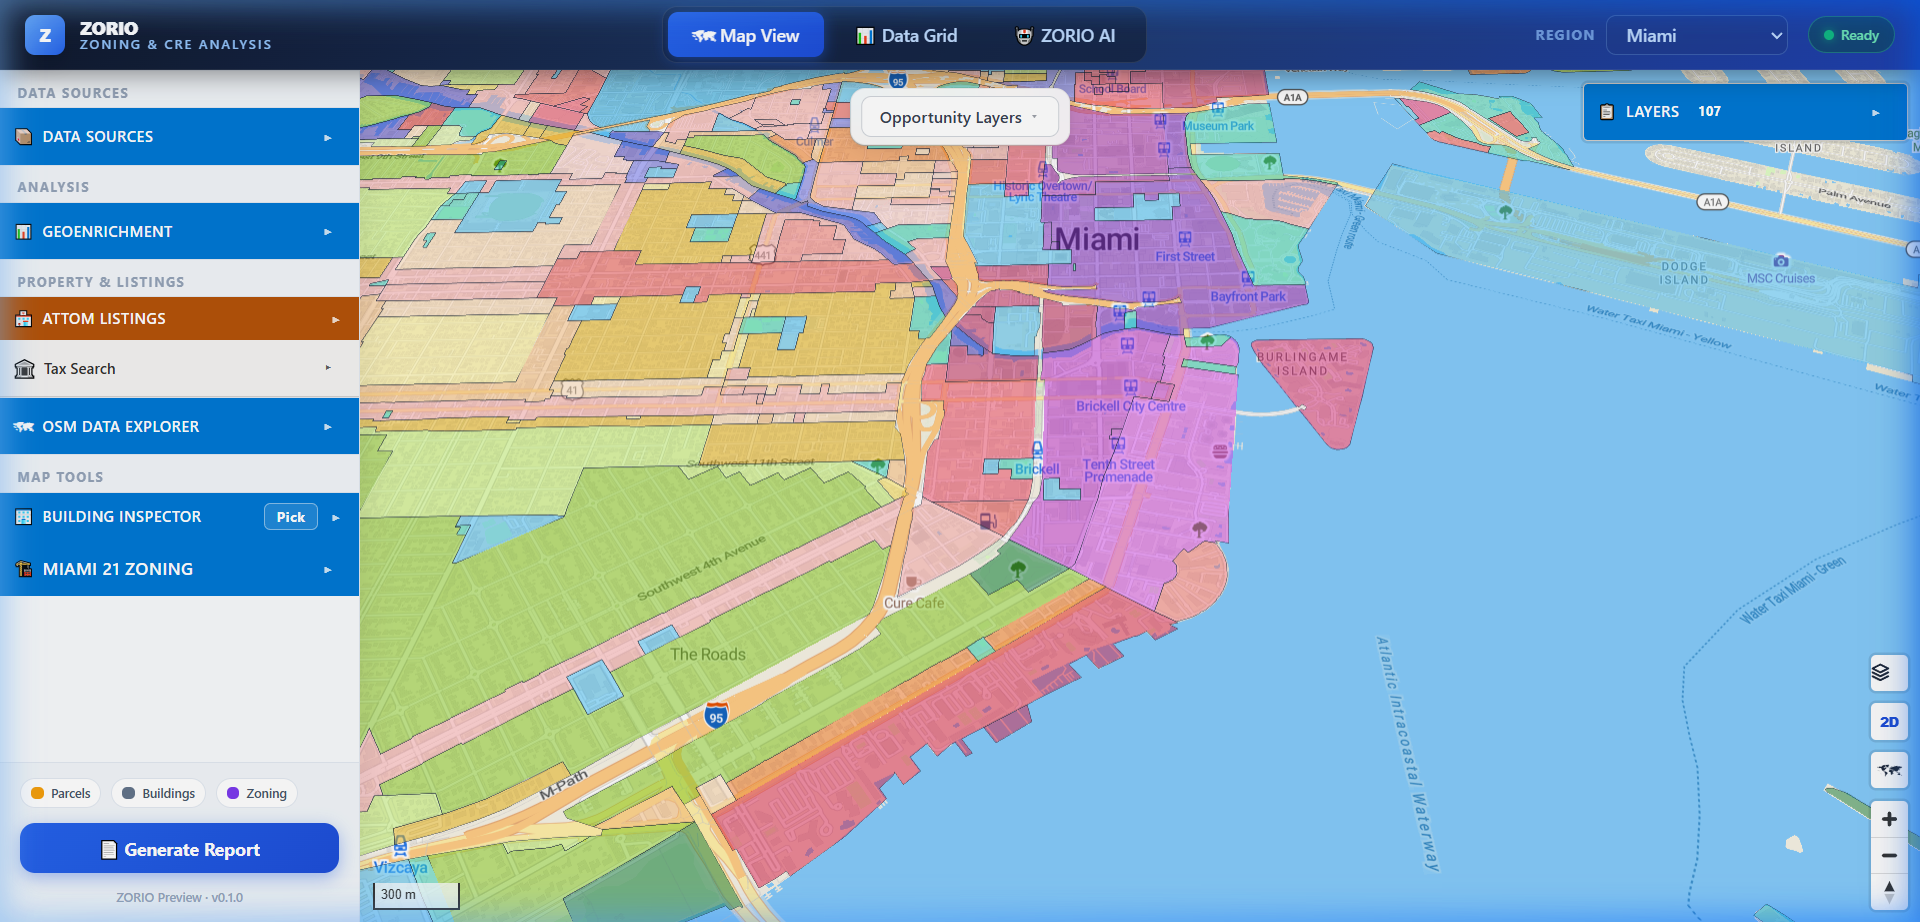
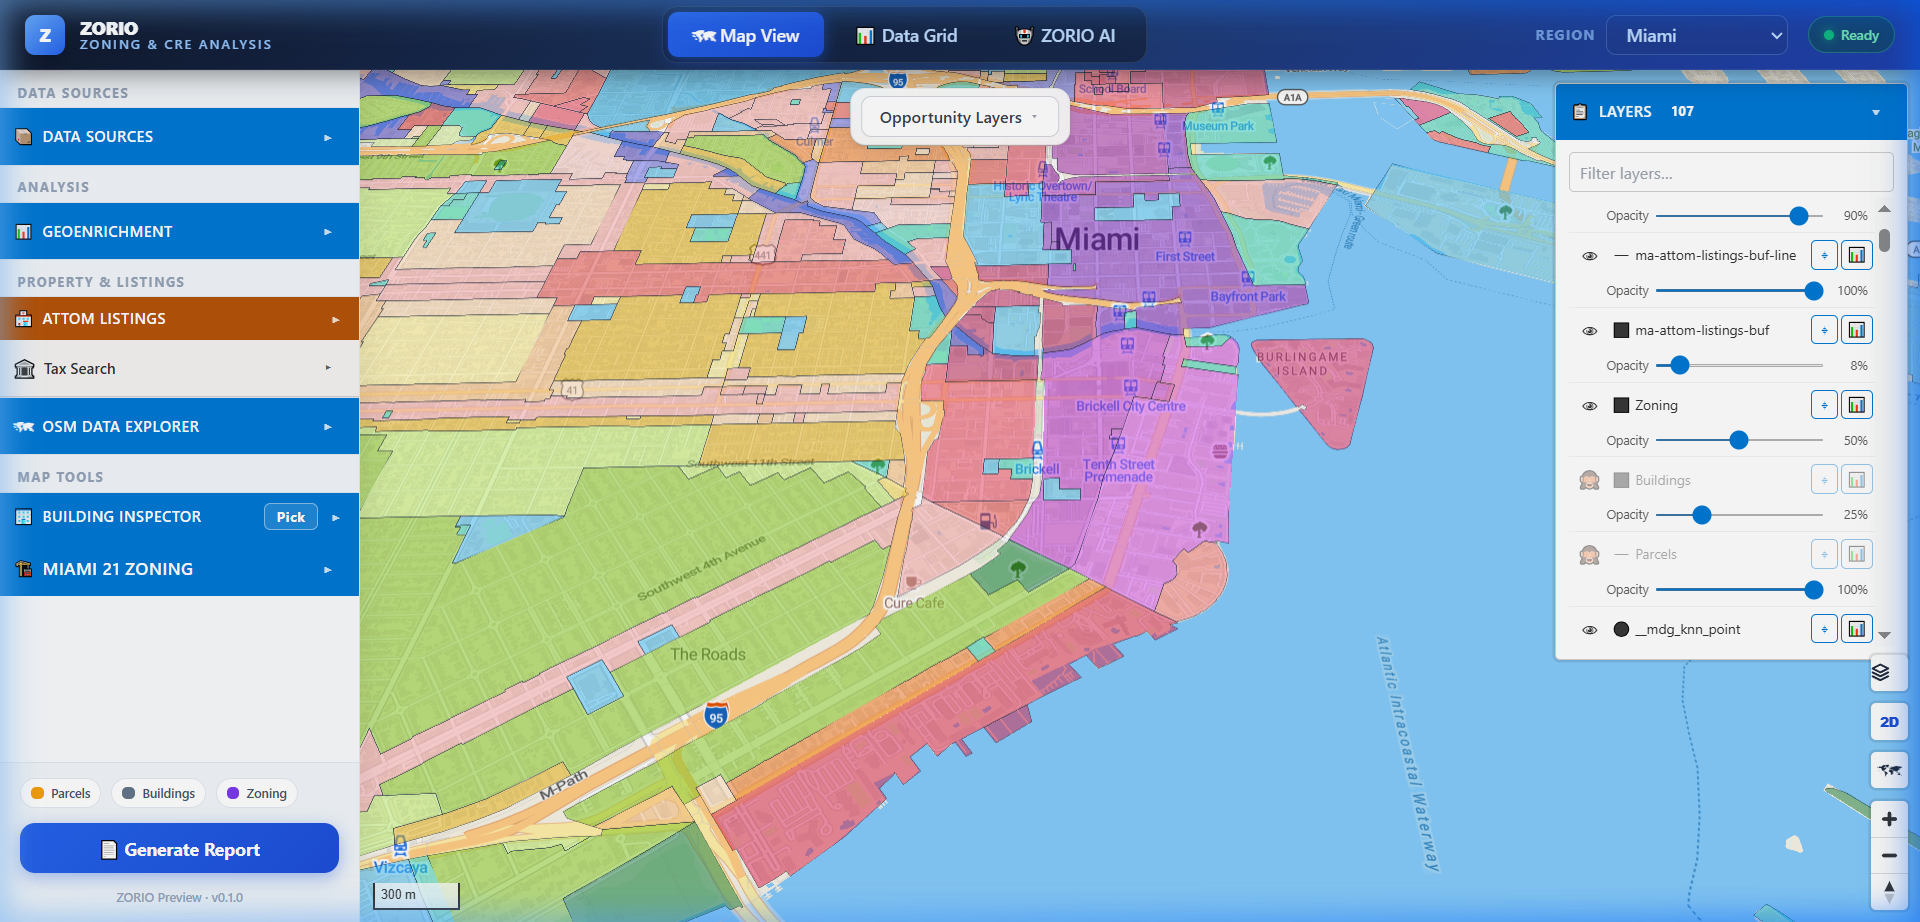
Map View for spatial work, Data Grid for tabular analysis, AI Analyst for questions — with the layer catalog and opportunity layers shared across all three.
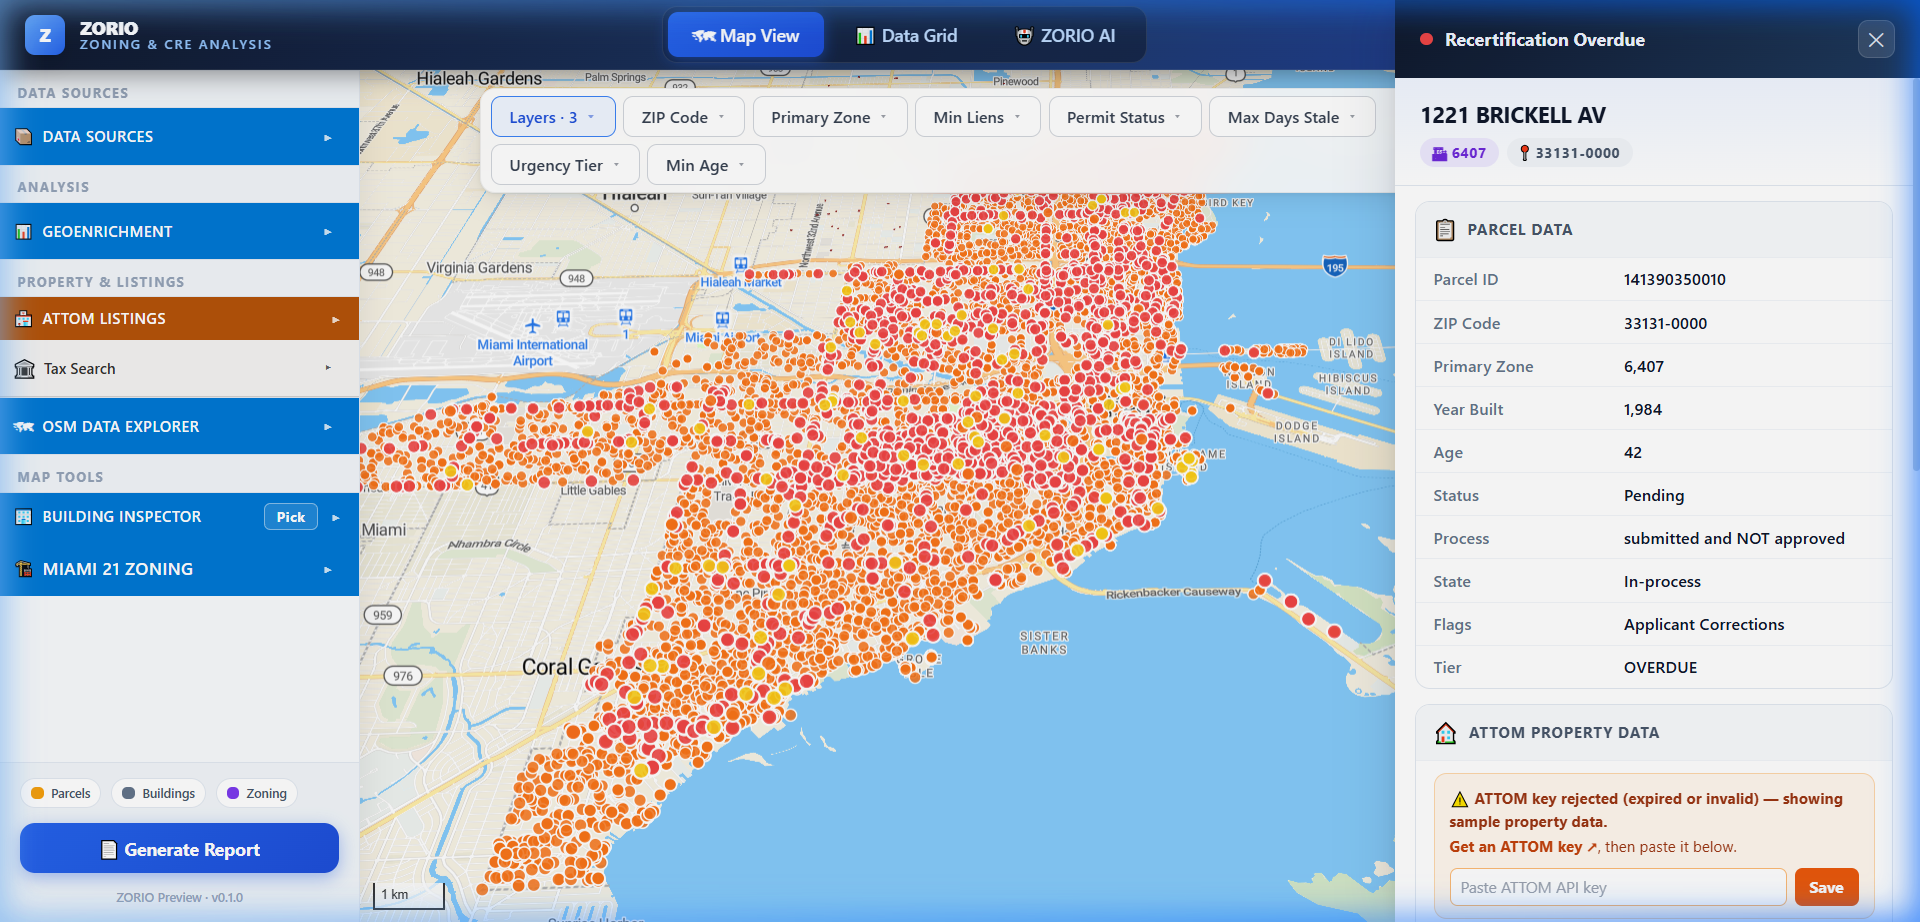
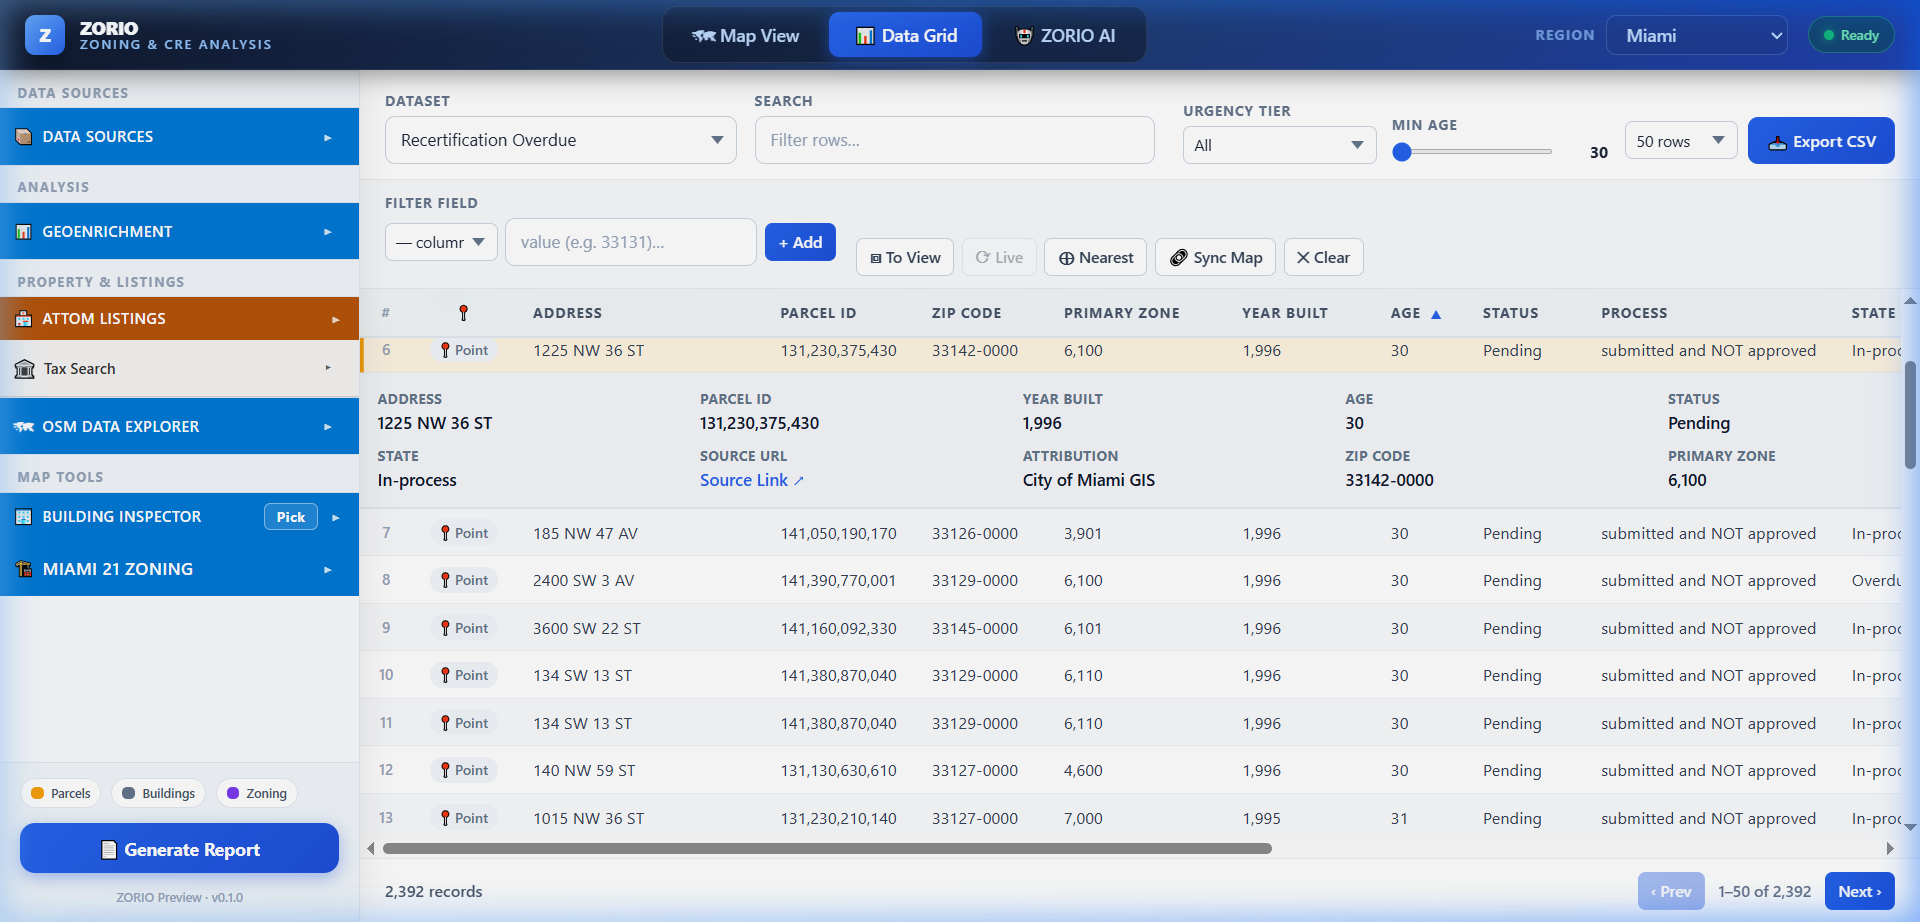
Sorting, filtering and fly-to from the attribute table.
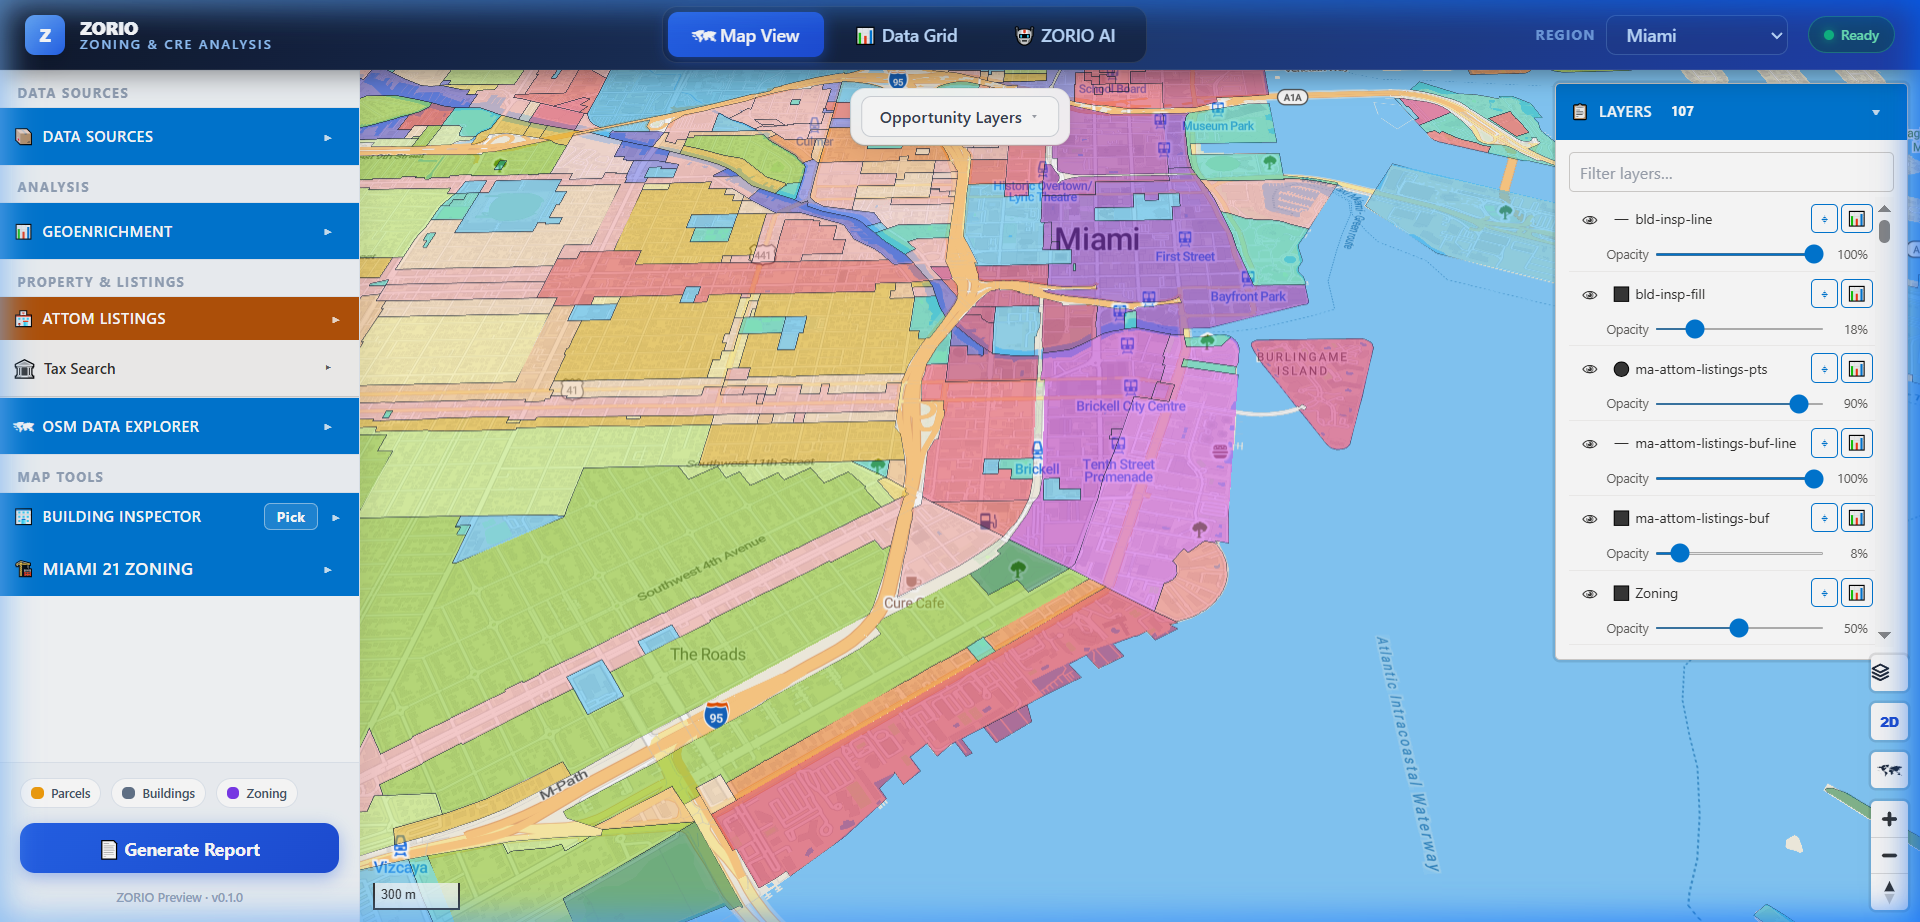
Toggling analysis layers and inspecting scored parcels.
What ships in the box
A selection of the control surface — each item is an importable class with a headless client behind it.
| Area | Controls & clients |
|---|---|
| Authentication | OAuth2/PKCE, API key, generateToken and app-credential flows against ArcGIS Online, Server, Portal and Enterprise |
| ESRI layers | Feature, Dynamic Map, Tiled Map, Image and Vector Tile Services; OSM FeatureServer; NAIP and USGS imagery; DEM terrain and hillshade |
| Portal | WebMap, WebScene, CatalogLayer, ArcGIS Hub browser, Living Atlas browser, USA government GIS directory browser |
| Parcel & property | Regrid parcel boundaries, ATTOM property detail and area listings, Broward and Miami-Dade tax and appraisal search |
| CRE analysis | Analysis panel, layer catalog by tier, ACS data fetcher, report builder, scoring dashboard |
| GeoEnrichment | Side-panel control, full-screen modal with six visualization tabs, headless client, DuckDB cache bridge |
| DuckDB WASM | File and URL loader, attribute table, smart filter, geoprocessor, geoprocessing wizard, QGIS-style spatial context menu |
| Cloud-native | COG and S3 COG, Pyodide raster analytics, COPC LiDAR, PMTiles, STAC browser, GeoParquet and FlatGeoBuf |
| 3D | Google Photorealistic 3D Tiles and OGC 3D Tiles 1.1 styled by category, numeric range or expression |
| Editing & admin | Feature Service create/update/delete, GeoJSON ↔ ESRI JSON conversion, no-code Style Admin panel with export/import |
| Map UI | Layer list, minimap, geocoder, coordinates, nearby, elevation profile, graticule, distance and bearing, imagery swipe, spatial bookmarks, building inspector |
* Counts reflect the documented control surface of the shipping library. ArcGIS GeoEnrichment consumes ArcGIS credits at ESRI's published rates; ATTOM, Regrid and county tax sources require their own credentials.
Import one control or the whole framework
Land Intelligence ships as a tree-shakeable TypeScript library. Add a single parcel control to a map you already have, or describe an entire application in YAML and let the Python CLI build it into a portable static page with the COOP/COEP headers DuckDB WASM needs.
- npm library —
maplibre-arcgisplusmaplibre-gl, with full TypeScript types. - Python CLI —
init,validate,build,serveandconvert webmap. - Headless clients behind every UI control, so you can use the data without the panel.
- Style Admin export — ship a
layer-styles.jsonfrom your server and load it at startup.
# TypeScript / browser library
npm install maplibre-arcgis maplibre-gl

# YAML-driven Python CLI
cd cli && pip install -e .

# Scaffold, validate, build and serve a map application
maplibre-arcgis init
maplibre-arcgis validate map.yaml
maplibre-arcgis build    map.yaml
maplibre-arcgis serve    map.yaml

# Convert an existing ArcGIS WebMap into YAML
maplibre-arcgis convert webmap ITEM_ID
import {
  RegridParcelControl,
  ATTOMListingsControl,
  ATTOMClient,
} from 'maplibre-arcgis';

// Nationwide parcel boundaries with click-to-identify
map.addControl(new RegridParcelControl({ auth }), 'top-left');

// Area search — radius, ZIP or drawn polygon
map.addControl(new ATTOMListingsControl({
  apiKey: 'YOUR_ATTOM_API_KEY',
  defaultMode: 'radius',
  defaultRadiusMiles: 2,
  allowedPropertyClasses: ['COMMERCIAL', 'INDUSTRIAL', 'AGRICULTURAL'],
}), 'top-left');

// Headless — same data, no UI
const client  = new ATTOMClient({ apiKey: 'YOUR_ATTOM_API_KEY' });
const detail  = await client.getDetail({ address1: '123 Main St', address2: 'Miami, FL 33130' });
const avm     = await client.getAVM({ address1: '123 Main St', address2: 'Miami, FL 33130' });
const history = await client.getSalesHistory({ address1: '123 Main St', address2: 'Miami, FL 33130' });
import { DuckDBGISLoader, DuckDBGeoprocessor } from 'maplibre-arcgis';

const loader = await DuckDBGISLoader.create();
const gp     = new DuckDBGeoprocessor(loader);

// Shapefile, GeoParquet, FlatGeoBuf, GeoPackage, KML, CSV…
await loader.loadUrl('https://example.com/parcels.fgb');

// Everything below runs in the browser — no upload, no server
const buffered  = await gp.buffer({ tableName: 'sites', distance: 500, units: 'meters' });
const joined    = await gp.spatialJoin({ leftTable: 'sites', rightTable: 'zones', predicate: 'ST_Intersects' });
const dissolved = await gp.dissolve({ tableName: 'parcels', dissolveKey: 'ZoningCode' });

// Or drop straight to SQL
const rows = await loader.query('SELECT ZoningCode, count(*) FROM parcels GROUP BY 1');
import { GeoEnrichmentClient, GEOENRICH_DATA_COLLECTIONS } from 'maplibre-arcgis';

const client = new GeoEnrichmentClient({
  proxyUrl: '/api/geoenrich', // keeps the API key server-side
});

// 5-mile ring around a site
const result = await client.enrich({
  studyAreas: [{ geometry: { x: -80.19, y: 25.76 } }],
  studyAreasOptions: { areaType: 'RingBuffer', bufferRadii: [5], bufferUnits: 'Miles' },
  dataCollections: [
    GEOENRICH_DATA_COLLECTIONS.KEY_US_FACTS,
    GEOENRICH_DATA_COLLECTIONS.INCOME,
  ],
});

// Branded due-diligence report as a PDF blob
const blob = await client.createReport({
  studyAreas: [{ geometry: { x: -80.19, y: 25.76 } }],
  reportTemplate: 'community_profile',
  format: 'pdf',
  reportFields: { title: 'Site Report', subtitle: 'Prepared by TMG' },
});
See Land Intelligence on your jurisdiction
Send us a county and a question — underbuilt parcels, a rezoning thesis, a site-selection shortlist — and we will demo it against that data.